

|
First a few definitions:
For the central game on the 33-hole English Board, the following table shows the size of the sets Bn and B-n. The 8-fold symmetry of the problem was taken into account, but no resource count was used. Because of the symmetry of the problem, we really should refer to equivalence classes of board positions (this is important to realize when calculating set intersections). However it simplifies our thinking if we select one representative board position from each equivalence class, so the sets Bn are sets of board positions.
| n (level) | |Bn| | Ratio | Pegs | |B-n| | Ratio | Pegs |
|---|---|---|---|---|---|---|
| 0 | 1 | 32 | 1 | 1 | ||
| 1 | 1 | 1.00 | 31 | 1 | 1.00 | 2 |
| 2 | 2 | 2.00 | 30 | 16 | 16.0 | 3-10 |
| 3 | 9 | 4.50 | 28-29 | 979 | 61.2 | 4-19 |
| 4 | 47 | 5.22 | 27-28 | 14,115 | 14.4 | 5-21 |
| 5 | 263 | 5.60 | 25-27 | 126,902 | 8.99 | 6-22 |
| 6 | 1,452 | 5.52 | 23-26 | 632,451 | 4.98 | 7-23 |
| 7 | 7,772 | 5.35 | 20-25 | 1,954,152 | 3.09 | 8-25 |
| 8 | 38,150 | 4.91 | 16-24 | 3,770,028 | 1.93 | 9-26 |
| 9 | 164,297 | 4.31 | 14-23 | 4,949,879 | 1.31 | 10-26 |
| 10 | 585,567 | 3.56 | 12-22 | 4,796,624 | 0.97 | 11-27 |
| 11 | 1,641,177 | 2.80 | 10-21 | 3,576,434 | 0.75 | 13-28 |
| 12 | 3,426,496 | 2.09 | 8-20 | 2,113,413 | 0.59 | 14-28 |
| 13 | 5,111,387 | 1.49 | 5-19 | 1,003,420 | 0.48 | 15-29 |
| 14 | 5,327,135 | 1.04 | 5-18 | 387,982 | 0.39 | 16-30 |
| 15 | 3,909,899 | 0.73 | 2-17 | 115,922 | 0.30 | 17-30 |
| 16 | 2,093,768 | 0.54 | 2-16 | 28,134 | 0.24 | 19-31 |
| 17 | 843,917 | 0.40 | 1-15 | 4,589 | 0.16 | 20-31 |
| 18 | 255,301 | 0.30 | 1-14 | 604 | 0.13 | 22-32 |
| 19 | 57,579 | 0.23 | 3-13 | 37 | 0.06 | 22-29 |
| 20 | 10,037 | 0.17 | 4-12 | 5 | 0.14 | 26-29 |
| 21 | 1,268 | 0.13 | 5-11 | 0 | 0.00 | |
| 22 | 148 | 0.12 | 6-10 | |||
| 23 | 15 | 0.10 | 7-9 | |||
| 24 | 0 | 0.00 | ||||
| Total | 23,475,688 | ~130 MB | 23,475,688 | ~130 MB | ||
|
Table 1: "Ratio" is |Bn|/|Bn-1|, or |B-n|/|B-(n-1)|. "Pegs" is the range in the number of pegs for all boards on this level.
For a forward/backward search, only the green entries need to be calculated, |
||||||
Note that the total number of boards in Bn
or B-n over all n are identical.
This actually provides a good check that the algorithm is working properly,
why must it be the case?
If a specific board pattern b lies in some
Bn, then by definition this board position
is reachable from the central vacancy in n moves.
Therefore it is possible to play from b' to the final state,
but not necessarily in n moves,
so b' must lie in some B-m.
In fact,
 .
.
Bergholt's 18 move solution can be recovered from
The above table also contains some general results:
|
|
|
|
|
|
|||||||||||||||||||||||||||||||||||||||||||||||||||||||||||||||||||||||||||||||||||||||||||||||||||||||||||||||||||||||||||||||||||||||||||||||||||||||||||||||||||||||||||||||||||||||||||||||||||||||||||||||||||||||||||||||||||||||||||||||||||||||||||||||||||||||||||||||||||||||||||||||||||||||||||||||||||||||||||||||||||||||||||||||||||||||||||||||||||||||||||||||||||||||||||||||||||||||||||||||||||||
| 23 moves are required to reach these positions from the central vacancy. The positions with 9 pegs (the right three) can only be reached by using single jump moves. The rightmost board is also the only one (of 15 total) that can appear in a solution to the central game. | |||||||||||||||||||||||||||||||||||||||||||||||||||||||||||||||||||||||||||||||||||||||||||||||||||||||||||||||||||||||||||||||||||||||||||||||||||||||||||||||||||||||||||||||||||||||||||||||||||||||||||||||||||||||||||||||||||||||||||||||||||||||||||||||||||||||||||||||||||||||||||||||||||||||||||||||||||||||||||||||||||||||||||||||||||||||||||||||||||||||||||||||||||||||||||||||||||||||||||||||||||||||||
|
|
|
|
|
|
|||||||||||||||||||||||||||||||||||||||||||||||||||||||||||||||||||||||||||||||||||||||||||||||||||||||||||||||||||||||||||||||||||||||||||||||||||||||||||||||||||||||||||||||||||||||||||||||||||||||||||||||||||||||||||||||||||||||||||||||||||||||||||||||||||||||||||||||||||||||||||||||||||||||||||||||||||||||||||||||||||||||||||||||||||||||||||||||||||||||||||||||||||||||||||||||||||||||||||||||||||||
| These positions can be reduced to a single peg at the center in a minimum of 20 moves. None of these board positions can appear in a solution to the central game. How do we know this? Because the complement cannot be reduced to a single peg. | |||||||||||||||||||||||||||||||||||||||||||||||||||||||||||||||||||||||||||||||||||||||||||||||||||||||||||||||||||||||||||||||||||||||||||||||||||||||||||||||||||||||||||||||||||||||||||||||||||||||||||||||||||||||||||||||||||||||||||||||||||||||||||||||||||||||||||||||||||||||||||||||||||||||||||||||||||||||||||||||||||||||||||||||||||||||||||||||||||||||||||||||||||||||||||||||||||||||||||||||||||||||||
One common peg solitaire puzzle is to take a given "shape" of pegs and attempt to reduce it to a single peg, usually in the center of the board. Once this "reduction problem" has been solved, we then can try to solve it in the smallest number of moves. If you try to solve the problem using a computer, checking each problem individually can take quite some time. Calculating the sets B-m is a much more efficient way to proceed. Note that (by definition) every board pattern in B-m can be reduced to one peg in m moves, and the set contains every possible pattern that can be so reduced. In a single (2 hour) calculation, we therefore have solved every conceivable reduction problem! The only constraint is that the jumps must all be made on the 33-hole board. Some of these problems can be solved in fewer moves if one allows jumps to holes that are not on this board, and there exist patterns of pegs on the 33-hole board that cannot be reduced to a single peg by using jumps on the board, but can be reduced to a single peg if jumps off this board are allowed.
If the final board position is the complement of the initial board position, then in addition we have:
| n (level) | |Sn| | Ratio | Pegs | |Wn| | % Winning |
|---|---|---|---|---|---|
| 0 | 1 | 32 | 1 | 100% | |
| 1 | 1 | 1.00 | 31 | 1 | 100% |
| 2 | 2 | 2.0 | 30 | 2 | 100% |
| 3 | 8 | 4.0 | 29 | 8 | 100% |
| 4 | 39 | 4.88 | 28 | 38 | 97.4% |
| 5 | 171 | 4.38 | 27 | 164 | 95.9% |
| 6 | 719 | 4.20 | 26 | 635 | 88.3% |
| 7 | 2,757 | 3.83 | 25 | 2,089 | 75.8% |
| 8 | 9,751 | 3.54 | 24 | 6,174 | 63.3% |
| 9 | 31,312 | 3.21 | 23 | 16,020 | 51.2% |
| 10 | 89,927 | 2.87 | 22 | 35,749 | 39.8% |
| 11 | 229,614 | 2.55 | 21 | 68,326 | 29.8% |
| 12 | 517,854 | 2.26 | 20 | 112,788 | 21.8% |
| 13 | 1,022,224 | 1.97 | 19 | 162,319 | 15.9% |
| 14 | 1,753,737 | 1.72 | 18 | 204,992 | 11.7% |
| 15 | 2,598,215 | 1.48 | 17 | 230,230 | 8.9% |
| 16 | 3,312,423 | 1.27 | 16 | 230,230 | 8.9% |
| 17 | 3,626,632 | 1.09 | 15 | 204,992 | 5.7% |
| 18 | 3,413,313 | 0.94 | 14 | 162,319 | 4.8% |
| 19 | 2,765,623 | 0.81 | 13 | 112,788 | 4.1% |
| 20 | 1,930,324 | 0.70 | 12 | 68,326 | 3.5% |
| 21 | 1,160,977 | 0.60 | 11 | 35,749 | 3.1% |
| 22 | 600,372 | 0.52 | 10 | 16,020 | 2.7% |
| 23 | 265,865 | 0.44 | 9 | 6,174 | 2.3% |
| 24 | 100,565 | 0.38 | 8 | 2,089 | 2.1% |
| 25 | 32,250 | 0.32 | 7 | 635 | 2.0% |
| 26 | 8,688 | 0.27 | 6 | 164 | 1.9% |
| 27 | 1,917 | 0.22 | 5 | 38 | 2.0% |
| 28 | 348 | 0.18 | 4 | 8 | 2.3% |
| 29 | 50 | 0.14 | 3 | 2 | 4.0% |
| 30 | 7 | 0.14 | 2 | 1 | 14.3% |
| 31 | 2 | 0.29 | 1 | 1 | 50.0% |
| Total | 23,475,688 | ~130 MB | 1,679,072 | 7.2% | |
|
Table 2: "Ratio" is |Sn|/|Sn-1|. "Pegs" is the number of pegs for all boards on this level. See a similar table for the Wiegleb's Central Game |
|||||
Table 2 agrees with that calculated by "Durango Bill"
[W9].
Note also that the total
I have entered the (finite) sequences |Sn| and |Wn| into The On-Line Encyclopedia of Integer Sequences as A112737 and A112738.
If we take the union of Wn over n=0,2, ..., 15,
we obtain a special set X of 839,536 board positions.
What is so special about this set?
If
The symmetry of the board must be carefully considered in this calculation. As before we consider board positions that are identical via reflection and/or rotation as the same board position. For example after the first jump there are four possible board positions, however since these are all rotations of each other we consider this as only one board position, which occurs with probability 1. Things become more complicated later in the game, because two completely different jump sequences may result in board positions that are exact 90-degree rotations of each other (for example), which by our accounting are the same board position.
Looking at the last column of Table 2, you may conclude that if our random player makes 15 jumps, there is an 8.9% chance that the board is still in a "winning position" (can be reduced to one peg assuming perfect play). However this type of reasoning is incorrect because it assumes each board position is equally likely, which is actually far from true. In fact a random player is much less likely to remain in a winning board position, and after 15 random jumps the chance that the board is in a winning position is less than 1%.
Table 3 below shows where a randomly played game is likely to end. A "dead end" is a board position from which no jump is possible (game over), and we show the number of dead ends, and the probability that the game ends after exactly n jumps. The probability that the central vacancy start finishes with one peg (at either the center d4, or d2, b4, f4 or d6) is 2.6978E-08, or about 1 in 37 million games. The probability that the final peg ends up in the center is exactly half this, or 1 chance in 74 million (even on the final jump, our random player has a 50% chance of going the wrong direction).
| n (jump) | Pegs left | Dead ends | Probability that the game ends after n jumps |
||
|---|---|---|---|---|---|
| 6 | 26 | 1 | 7.4074E-03 | exactly 1 in 135 | |
| 7 | 25 | 0 | 0 | never | |
| 8 | 24 | 0 | 0 | never | |
| 9 | 23 | 0 | 0 | never | |
| 10 | 22 | 1 | 9.7435E-06 | 1 in 102,633 | |
| 11 | 21 | 1 | 6.8999E-05 | 1 in 14,493 | |
| 12 | 20 | 0 | 0 | never | |
| 13 | 19 | 5 | 5.7230E-05 | 1 in 17,473 | |
| 14 | 18 | 10 | 1.0757E-04 | 1 in 9,296 | |
| 15 | 17 | 7 | 2.6607E-04 | 1 in 3,758 | |
| 16 | 16 | 27 | 1.7353E-04 | 1 in 5,763 | |
| 17 | 15 | 47 | 6.6371E-04 | 1 in 1,507 | |
| 18 | 14 | 121 | 1.4401E-03 | 1 in 694 | |
| 19 | 13 | 373 | 4.1355E-03 | 1 in 242 | |
| 20 | 12 | 925 | 9.8602E-03 | 1 in 101 | |
| 21 | 11 | 1972 | 2.5485E-02 | 1 in 39 | |
| 22 | 10 | 3346 | 7.6543E-02 | 1 in 13 | |
| 23 | 9 | 4356 | 1.5044E-01 | 1 in 6.6 | |
| 24 | 8 | 4256 | 1.9958E-01 | 1 in 5.0 | |
| 25 | 7 | 3054 | 2.4665E-01 | 1 in 4.1 | |
| 26 | 6 | 1715 | 1.6347E-01 | 1 in 6.1 | |
| 27 | 5 | 665 | 7.9883E-02 | 1 in 13 | |
| 28 | 4 | 182 | 3.0672E-02 | 1 in 33 | |
| 29 | 3 | 39 | 3.0107E-03 | 1 in 332 | |
| 30 | 2 | 6 | 7.7690E-05 | 1 in 12,872 | |
| 31 | 1 | 2 | 2.6978E-08 | 1 in 37.07 million | |
| Total | 21,111 | 1.0000E+00 | |||
|
Table 3: How the game will end if a player selects jumps at random. Calculated exact values from level calculations, probabilities confirmed by Monte Carlo simulation. |
|||||
Our random player is expected to finish most often with 7 pegs, and with a mean of 7.64 pegs. If we compare these results with those of "average" human players, we find that most are able to do quite a bit better than this. The reason, of course, is that human players do not select jumps at random. Most people will try to clear out the arms without stranding a peg near the edge of the board, and a lot of people can get down to 2 or 3 pegs after 10 attempts or less.
While a modern computer can simulate a million games in a matter of seconds, such a brute force technique expends an awful lot of effort to find a single solution, and will fail entirely for larger boards. Making random jumps is actually one of the worst strategies to adopt in solving the central game.
Finally, it is interesting to find the most and least likely ending board positions for a randomly played game:
|
|
|
||||||||||||||||||||||||||||||||||||||||||||||||||||||||||||||||||||||||||||||||||||||||||||||||||||||||||||||||||||||||||||||||||||||||||||||||||||||||||||||||||
| The most likely finish to a random game, also the shortest possible game (6 jumps). One out of every 135 randomly played games ends at this board position. What six jumps are needed to reach this board position? | The least likely finish to a random game. One out of every 70.4 billion randomly played games ends at this board position. Can you figure out how to reach this board position? Hint: Where must the pegs at d2, b4, d4 and f4 have started from? |
The nodes of the solution graph are the board positions along minimal length solutions, and the links joining them are the moves between these board positions. As a result of our calculation by levels, we already have some of these board positions, namely those in the intersection between the forward and backward level sets (B11 and B-7 in our example). To recover all the board positions in any minimal length solution, it is just a matter of tracing these board positions both backward and forward in the level sets.
The solution graph for the English central game is shown below.
The left node (B) is the board position with the central vacancy, while
the right node (E1) is the final board position with one peg in the center.
This graph was produced by Sidney Cadot.
He uses a different notation for moves and board locations
(he numbers the holes consecutively 1-33).
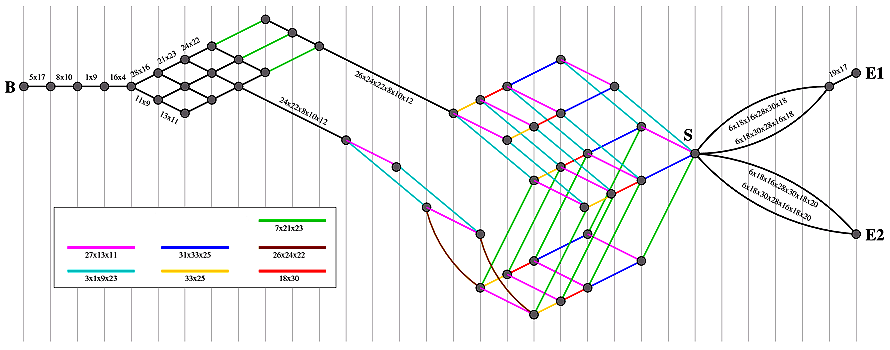
Note that Sidney has arranged the graph horizontally so that positions
with the same number of pegs lie on a vertical line.
I would align boards vertically by level, which would show that they all
contain the same number of moves.
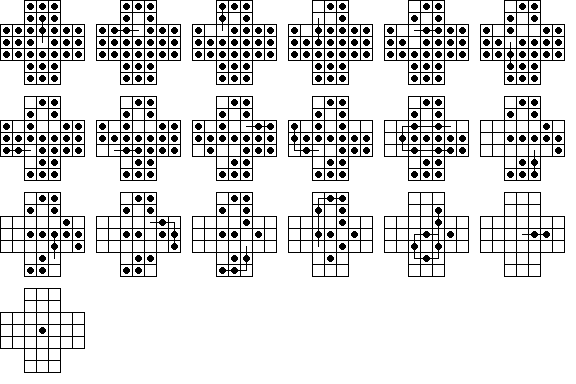
The figure below shows one of the possible 18-move solutions to the central game
(first found by Ernest Bergholt in 1912).
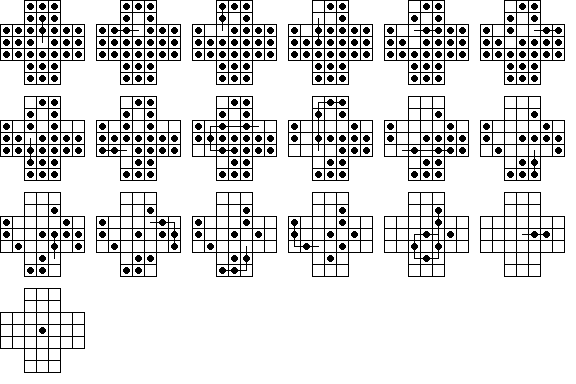
936 sounds like quite a few solutions, but most of these solutions have the exact same moves, just in a different order. Can we quantify this? If you look at the solution graph, you can see that there are really only two different paths to take. If you don't count the order of moves, there are really only two solutions. The top route in the solution graph is taken by the above solution, while the lower route is that taken in the solution below. As you can see, the difference between these solutions is quite subtle.
To count solutions regardless of move order, a similar, although somewhat more complex algorithm is used. At each node, instead of having a single number to keep track of, I use a sequence of lists, each of which is a set of moves that can used to reach that node, not counting order. These lists are sorted (in some known, but arbitrary order) so we can easily check for duplicates. Going through the tree in the same fashion, the number of solutions regardless of move order is the number of lists at the terminal node, and each list gives a possible solution.
Also, when all is done you have lists of solution moves, but you no longer know how to order the moves to make them solutions! Figuring out an order that will make it work can be non-trivial, so I found that at each node in the tree I wanted to store BOTH a sorted move list and the original (sequential) move list. This way at the end one can go back to the original list and recover each solution.
By the way it is also possible to use the same technique for solutions calculated by jump. In other words, we consider solutions of any length and consider them as sequences of jumps (not moves). The number of solutions to the central game regardless of jump order is extremely large and the memory on my PC fills up before this calculation is complete. However, I have been able to complete this calculation on smaller boards, particularly the triangular peg solitaire boards. In this case, the counting is a bit strange, for example a solution to a complement problem and the jumps executed in the exact reverse order are considered the same solution. This oddity doesn't happen when counting minimal solutions, because when such a solution is reversed it is almost never minimal length. But some counter-intuitive behavior can still occur, as shown in the next section.
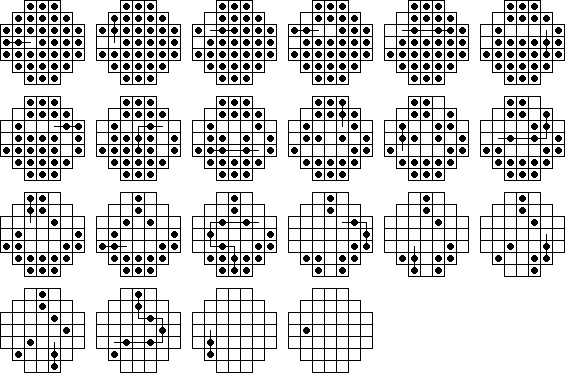
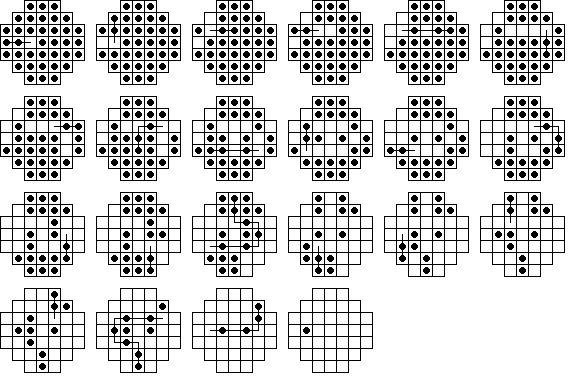
These two solutions have the first nine moves identical, but after that they appear to be different, and they finish very differently. However a careful check will show they actually contain exactly the same moves just in a different order. Thus, according to our accounting method, they are the same solution, even though their endings are completely different. Therefore, when grouping solutions regardless of move order, there is no longer a unique finishing move. The situation above is a rather unusual occurrence and is not true for the vast majority of cases (usually solutions with the same moves differ only in the middle), but must be taken into account for the general case. Although there is no unique final move, there is a definite longest final sweep length for any solution no matter what order it's moves are taken in (3 in the above example). Therefore, I now classify solutions according to three numbers (A,B,C):
Created in 2007. Last modified November 22nd, 2014
Copyright © 2014 by George I. Bell